



Core Web Vitals are three metrics Google chose to measure user experience: LCP for loading speed, INP for interaction responsiveness and CLS for visual stability. They are part of page experience signals and can matter on queries where competition is close; they do not replace relevance.
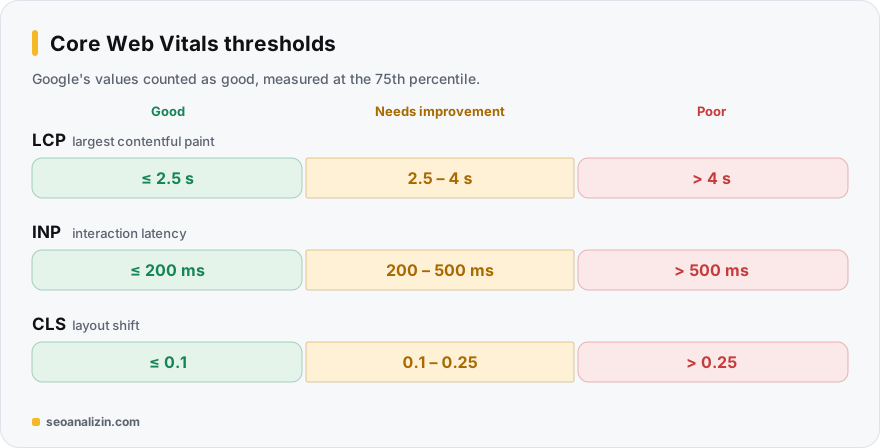
What the three metrics measure
- LCP (Largest Contentful Paint): how long it takes for the largest visual element on the page (often the hero image or headline block) to appear.
- INP (Interaction to Next Paint): how long the page takes to visually respond after a click, tap or key press. It replaced FID in March 2024.
- CLS (Cumulative Layout Shift): how much elements shift unexpectedly while the page loads.
Field data or lab data?
Field data is collected from real Chrome users and is the basis of Google's assessment; it usually shows the 75th percentile of the last 28 days. Lab data (Lighthouse) is a controlled test, ideal for debugging but not the assessment itself. The two can differ, and that is normal.
Where do you track it in SEOANALİZİN?
The free SEO Analysis report looks at technical performance indicators such as response time, page size, compression, caching and render-blocking scripts. For LCP, INP and CLS field data, sign in and use the Core Web Vitals Center, which shows mobile and desktop Lighthouse measurements together with historical trends.
Improving LCP
- Reduce server response time: caching and faster hosting.
- Serve the hero image at the right size and in a modern format (WebP, AVIF).
- Do not add
loading="lazy"to the hero image and give it high priority.
<link rel="preload" as="image" href="/img/hero.webp" fetchpriority="high">Improving INP
- Break long-running JavaScript tasks into pieces.
- Defer non-critical scripts with
defer. - Reduce or delay third-party scripts (chat, ads, tracking).
Improving CLS
- Give images and videos
widthandheight. - Reserve space for ads and embedded content.
- Use
font-display: swapfor web fonts and preload the font.
<img src="/img/banner.webp" width="1200" height="600" alt="...">For the rest of the mobile experience, see the mobile-friendliness guide too.
Example: a home page with a 4.2-second LCP
The home page's LCP is 4.2 seconds and the largest element is a 2.4 MB JPEG. The typical order of fixes: convert the image to WebP and shrink it to the right size, give it fetchpriority="high" and remove lazy loading from that image. In many cases these three changes bring LCP close to the good threshold.
After each change, measure the same page again; if you change five things at once you will not know which one worked.
Thresholds and the 75th percentile
Google judges the three metrics at the 75th percentile of visits: a metric counts as “good” if three out of four page loads pass the threshold. One fast test run is not enough; the data is field data collected from real users over the last 28 days.
- LCP (when the largest content element appears): good ≤ 2.5 s, needs improvement ≤ 4 s, poor > 4 s.
- INP (response time to interactions): good ≤ 200 ms, needs improvement ≤ 500 ms, poor > 500 ms.
- CLS (layout shift): good ≤ 0.1, needs improvement ≤ 0.25, poor > 0.25.
Core Web Vitals is one of the page experience signals, but Google says a good score alone does not earn rankings and that content relevance comes first. So put speed work next to content improvement, not in place of it.
Find which group of pages has the problem
Looking at one score for the whole site misleads. If PageSpeed Insights has no “Real user experience” section, the page lacks enough field data; the lab result then guides you but is not conclusive. The Core Web Vitals report in Search Console groups similar URLs and tells you “400 pages on this template have an LCP problem.” Start with the largest group, usually the product or article template; one template fix improves hundreds of URLs.
Finding the LCP element with DevTools
- Open the page in Chrome, open DevTools, and in the Performance tab record with “Reload and record”.
- Click the LCP marker on the timeline; it shows which element (often the hero image or a large heading) is the LCP.
- If it is an image, look at when its download starts: if it starts late, the browser discovers it late.
A code example for an image LCP
<!-- Hero image: discovered early, not lazy-loaded -->
<img src="/img/hero.webp" width="1200" height="630"
     fetchpriority="high" alt="Product team in a meeting room">

<!-- Images further down the page load lazily -->
<img src="/img/detail.webp" width="800" height="450"
     loading="lazy" alt="Report screen">
Three fixes gain the most on most pages: not using loading="lazy" on the hero image, giving it fetchpriority="high", and serving it at the right size as WebP or AVIF.
INP: finding the slow interaction
INP measures how long the page takes to respond to clicks, taps and key presses; it takes a near-worst interaction over the page's lifetime. In the lab, record a DevTools Performance trace while you open the menu and click a filter, and find the points that produce “long tasks” (over 50 ms). Common causes: heavy third-party scripts, a large JavaScript bundle occupying the main thread, and an expensive re-render on click. The fix is usually to remove unneeded scripts, split the work into chunks and give a fast first response to the click.
CLS: three habits that prevent shifts
<!-- 1) Give images dimensions -->
<img src="/img/chart.webp" width="800" height="450" alt="Monthly clicks chart">

<!-- 2) Reserve space for ads or embeds -->
<div style="min-height:250px"><!-- ad code --></div>

/* 3) Reduce text jumping while the font loads */
@font-face { font-family: "Inter"; src: url(/f/inter.woff2); font-display: swap; }
The most common causes of CLS are images without dimensions, late-loading ads, cookie banners inserted at the top after load, and font swaps.
When will you see results after a fix?
Lab measurement (the score at the top of PageSpeed) shows the change at once. Field data is a 28-day rolling window, so the effect appears slowly over a few weeks. To be sure the fix holds, look at the lab result on day one and at the Search Console field data after the third week; do not give up after a week because “nothing changed”.
Order of priority
- First the problems that hurt real users: an LCP above 4 seconds, a CLS above 0.25.
- Then template problems that affect many pages.
- Small gains last: shaving 50 ms off a script, for example.
Where people get stuck with Core Web Vitals
How much do Core Web Vitals affect rankings?
It is a light signal. It can make a difference between two pages of equal quality, but will not lift an irrelevant page.
Why do my test results differ?
Field and lab data measure different conditions. Device, connection and cache state change the result.
Why is there no field data on my new site?
Field data does not exist without enough real-user traffic. Work from lab data at first.



Join the discussion
Share your experience or ask a question about this guide.